Diesel joins the dashboard. Explore puts price differences and weekly changes in perspective. Get a broader view of U.S. fuel prices with the same simple GasPulse experience.
DieselExploreImprovements
Diesel, meet GasPulse.
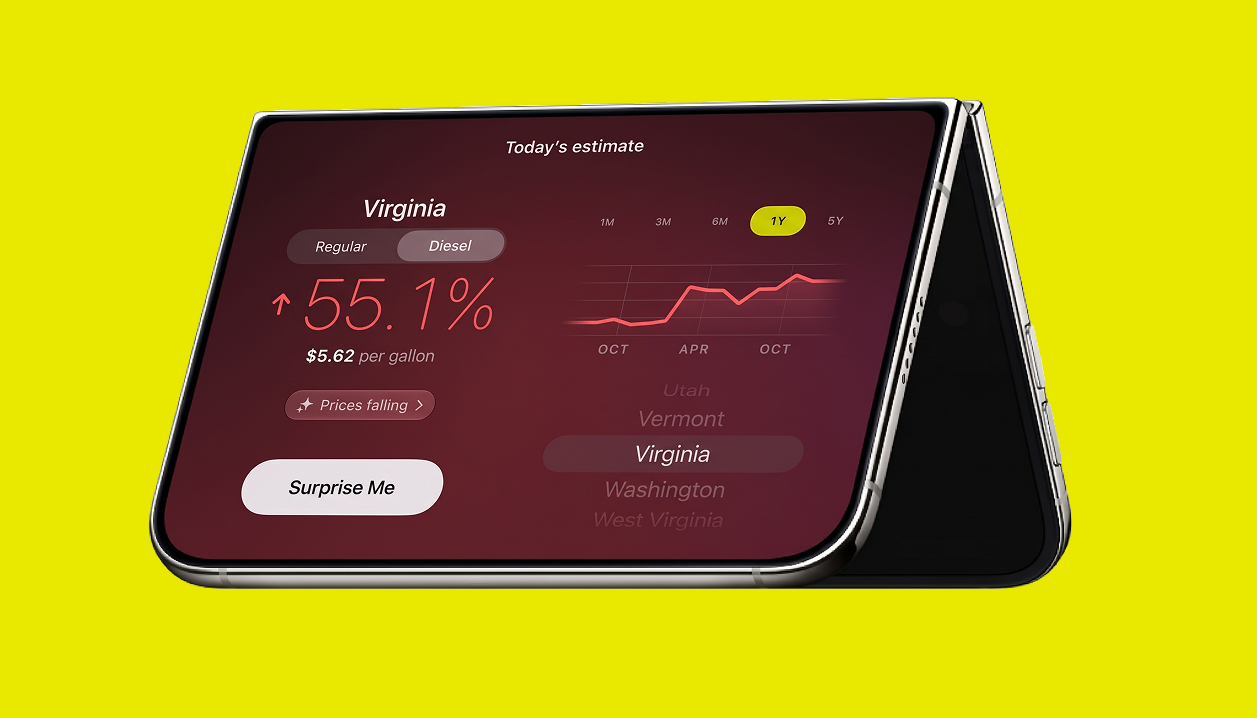
Switch between Regular and Diesel to follow weekly price averages, explore historical trends, and view a fuel-specific outlook. Diesel prices use official EIA data, with regional averages where state data isn’t available.
Fuel your curiosity.
Where are averages lowest? Where did they jump—or drop? The new Explore page brings together five rankings for Regular and Diesel: lowest averages, highest averages, biggest weekly increases, biggest weekly decreases, and the most volatile prices.
A look ahead for Diesel.
A separate four-week Diesel outlook shows projected ranges and confidence, so you can see both the possible direction and the uncertainty.
A little more tidy.
A more organized menu makes price units, app information, and support easier to find. Clearer saved-data messages explain when current data can’t be loaded.
Version 1.1.4 is available on the App Store. Rankings compare weekly area averages, not individual gas-station prices. Outlooks are estimates, not guarantees.
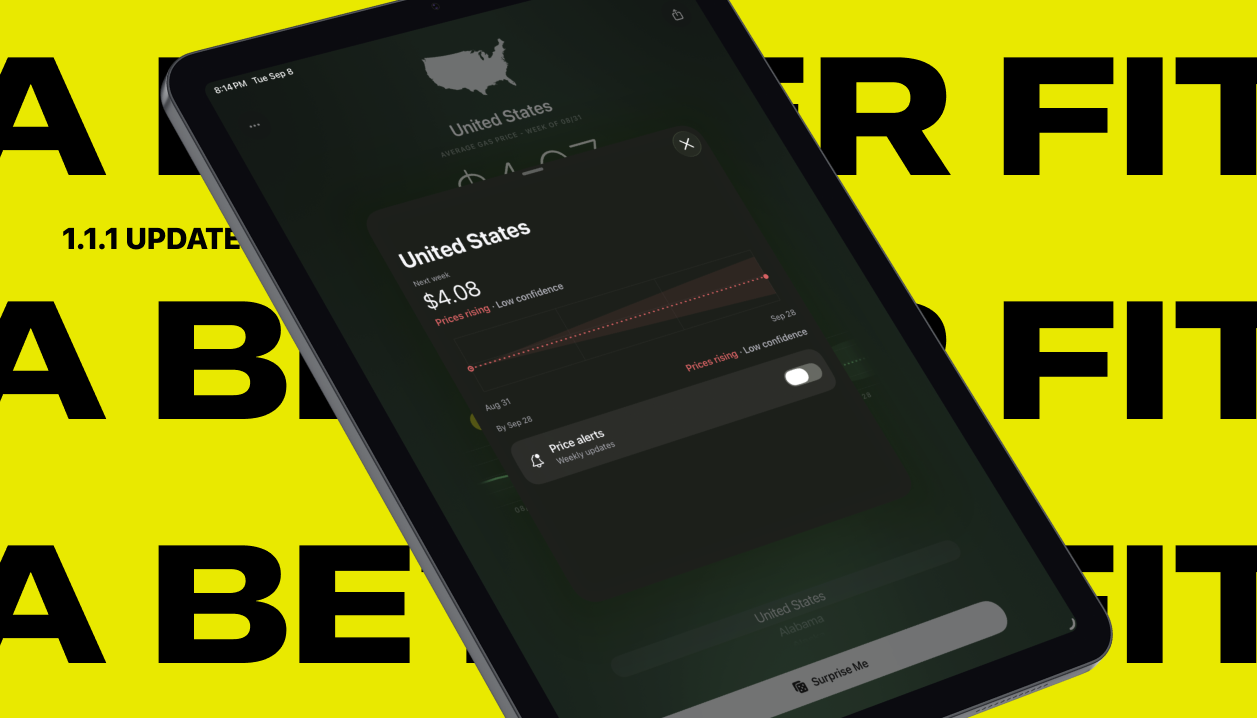
A more comfortable GasPulse on larger screens. Version 1.1.1 improves iPad and Mac layouts, refines chart interactions, and includes a smaller app bundle.
ImprovementsiPadMac
Made for more screen space
Improved layouts for iPad and Mac, including resizable windows.
A quick introduction to what’s new
A new What’s New screen introduces GasPulse features.
A smaller download
A smaller app bundle that preserves offline price data and widgets.
Refined details
Refinements to chart interactions and the Mac dashboard.
More ways to stay ahead of the pump. GasPulse 1.1 brings prices beyond the app, more personal controls, and a clearer view of what may come next.
New featuresImprovementsiOS
Your prices, at a glance
Add GasPulse to your Home Screen, Lock Screen, or StandBy. New widgets bring price trends and charts closer, with layouts designed for a quick check.
Ask Siri. Build a shortcut.
Use Check Gas and Gas Outlook with Siri and App Shortcuts, or add them to your own routines. Surprise Me opens GasPulse with a random state.
Updates for the states you follow
Choose up to six areas to follow, including states and the U.S. average. Turn on notifications for a combined weekly price-change digest. Quiet weeks stay quiet; delivery timing depends on iOS background refresh.
A daily estimate between weekly updates
When fresh market data is available, see an estimated current price between official weekly observations. Estimates are identified separately from reported averages, with clearer dates and fallback information.
More context for the road ahead
An expanded Outlook adds clearer forecast horizons, confidence information, and market context. Forecasts incorporate daily market signals and supply conditions; they remain estimates, not guarantees.
Choose how you read a change
Switch the dashboard between percentage changes and dollar changes. GasPulse remembers your preference when you reopen the app.
More room in landscape
Turn your phone for a wider layout, with more room to explore charts and price movement.
Share the same picture
Share an area with a richer link preview and links that open in GasPulse when available. Shared summaries have been refined to stay aligned with the app’s data.
Clearer, more dependable details
Improvements cover larger text sizes, VoiceOver, chart and widget presentation, historical date ranges, offline fallback, and reconnecting after a failed refresh. Forecast direction labels now follow the displayed price rounding.
Version 1.1 is available on the App Store. Update GasPulse to use these features.
A clearer way to follow gas prices. GasPulse turns weekly averages into trends, historical context, and a simple outlook for your next drive.
LaunchiOS
The weekly picture, made simple
Check the latest weekly U.S. gas-price average for your selected state or its applicable region, based on official EIA data. These are area averages, not individual station prices.
A little history goes a long way
Explore price movement over short periods and longer histories up to five years. Clear trends help you see whether prices are rising, falling, or staying steady.
Compare areas. Look ahead.
Compare state and regional averages and explore a simple price outlook. Some states share a regional data series; forecasts are estimates.
Free. Private. Ready to go.
No account, subscription, advertising, or in-app tracking. Enjoy a design that supports light and dark appearance.